Performance
After dozens of careful measurements I was able to determine the parasitic and induced
drag coeficients for my airplane. It turns out that those two numbers (scaled in fuel flow
units) determine the complete performance characteristics, and allow me to make any
performance chart I want. Here are two examples. First the true airspeed chart:
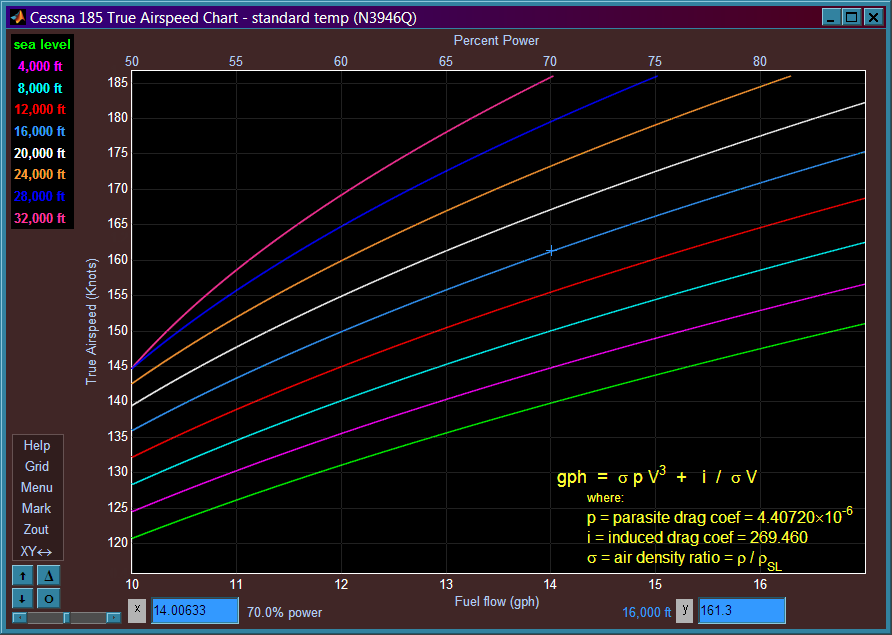
The upper axis limits for this chart (17 gph and 186knots) were somewhat arbitrary;
although (thanks to the turbonormalizer) I believe all the power settings shown are
achievable in the short term, in the long run CHT limits would restrict what can be
safely sustained to some subset of what is shown on the chart. The measurements used
to create the chart were all made below 16 thousand feet, so I was pleased that when
I did one flight at 26 thousand, the TAS agreed with what was predicted from the chart,
thus validating my mathematical model. Note that this chart assumes lean-of-peak (LOP)
mixture settings. With ROP settings it is not possible to correlate fuel flow with
peformance, since not all the energy in the fuel is used (i.e. some fuel is
simply blown out the exaust pipe.)
The next chart shows range and fuel efficiency as a function of fuel flow:

Serveral interesting facts can be seen from this diagram.
The peak of each curve
is the maximum range and the best fuel efficiency. Note that the best fuel
efficiency (14.51 nm/gal) is the same for all altitudes, however this is achieved
at different power settings. For example at 4,000 feet this efficiency is achieved
at a fuel flow of 6.5gph (32.3% power). However at 28,000 feet, the best efficiency
is the same but is achieved at a fuel flow of 9.6gph (48% power). So at best economy,
flying high won't save you any money (but you will get there much quicker). By the
way, this is true for any airplane, not just my C185! Note that these best efficiency
power settings are much lower than what pilots typically choose. Even when they think
they are throttling back for economy, usually they are still way above the most
economical setting. Perhaps subconsciously they are making a tradeoff between cost
and how long it will take to get where they are going.
You can follow each curve from the peak efficency (left) to even lower power
power settings. When you get as far left as you can go (e.g. 5.35 gph for the sea
level curve) you have found the best endurance power setting. The efficiency at
the best endurance setting is about 12.5 nm/gal and again that number does not
change with altiutude. Theoretically this would be the best power setting for
doing holding patterns, since you really are not trying to get anywhere. You
merely want to maintain altitude.
Note that the curves continue even beyond the best endurance value by bending
back on itself. Thus in a small range, there are actually two possible power
settings that will maintain the current altitude. The lower portion represents
what is known as the "back side of the power curve".
This completes your aerodynamics lesson for today :)